Front matter
ICC-3 (093)Acute Kidney Injury[L0006–L0026]
L0008
L0015
- What
- Goal: know the range of things that can cause AKI, not just one.
- Where
- The lecture's own Outline (Slide 4) splits this into prerenal, renal parenchymal and post-renal causes, plus a separate group of other causes — rhabdomyolysis, contrast, tumour lysis.
L0017
- What
- Goal: take a history and pick out the clinical findings in an AKI patient.
- Where
- Not named in the Outline, but covered later: 'Is it prerenal or renal?' opens with History and Clinical Examination (the rows below), and 'Clinical picture' covers oliguria and ATN's phases (the rows below).
- What
- Goal: know which investigations are done urgently when AKI is suspected.
- Why
- She calls these 'emergency' investigations but this slide does not say why they are urgent, or what makes AKI time-critical to investigate.
L0020
- What
- Goal: tell acute renal impairment/failure apart from chronic renal failure.
- How
- The 'Acute or chronic uremia?' slide gives five criteria: previous creatinine, the anaemia/PTH/phosphate/calcium pattern, kidney size on ultrasound, symptom chronicity, and oliguria (the rows below).
L0022
- What
- Goal: explain how management differs depending on which cause of AKI is present.
- Where
- The Slide 4 Outline names 'Management' as its own section, following the three-way causes split — prerenal, renal parenchymal, post-renal — that this goal maps to.
- What
- Goal: list the reasons AKI would push a patient to dialysis.
- Where
- Not named in the Outline, but covered later: the 'Renal replacement Therapy' slide lists five indications for dialysis (the rows below).
L0025
- What
- Goal: appreciate that acting fast on AKI matters, once it is suspected.
- Why
- The word 'reverse' frames AKI as something that can be undone if caught early — the reason prompt action is named as its own objective here.
Outline shown 1 of 6[L0028–L0041]
Definition[L0043–L0046]
L0044
- What
- AKI is a sudden drop in how well the kidneys work.
- Where
- Kidney function overall, not one named structure inside it.
- Why
- She marks the change as 'abrupt' but doesn't state why the speed of onset, rather than a slower decline, is what defines it as acute.
- When
- It develops over hours to days — that speed is what makes it 'acute'.
- What
- Most of the time, kidney function comes back on its own.
- Why
- She states it is usually reversible but does not say why some cases are and others are not.
- When
- Recovery, when it happens, takes days to weeks.
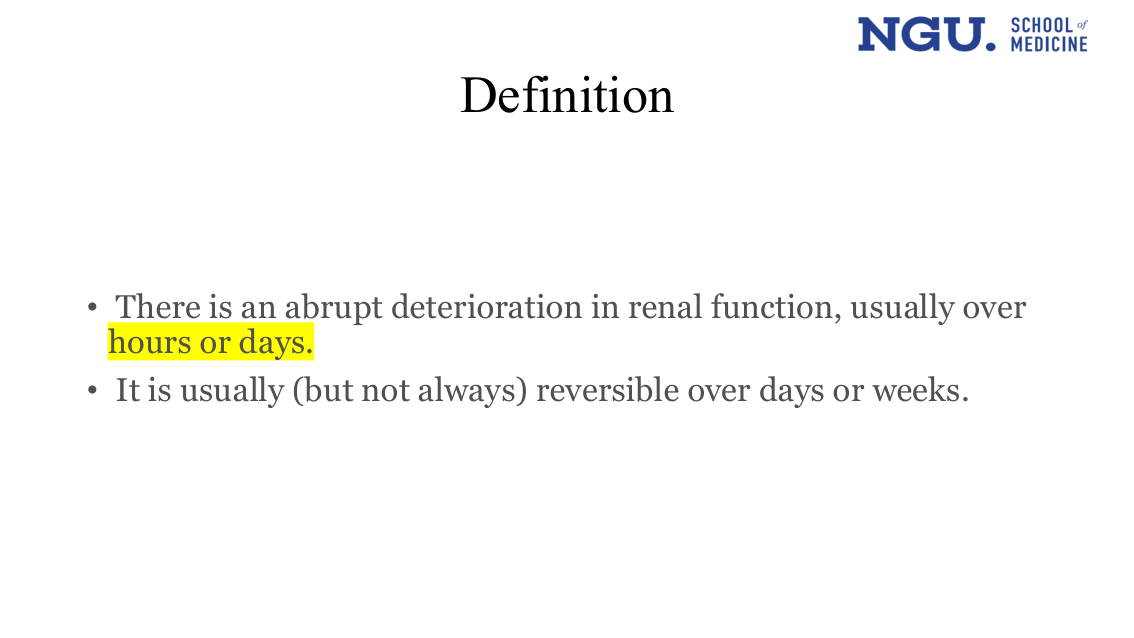
Two bullets matching the rows above verbatim. 'hours or days', in the first bullet, is highlighted yellow.
The highlight singles out the timing clause of the definition as the point to remember.
Outline shown 2 of 6[L0048–L0061]
Classification of kidney injury RIFLE and the network criteria[L0063–L0080]
Lines up each RIFLE tier against its AKIN counterpart on the same two measurements so a threshold match or a gap is visible stage by stage.
| Criteria | RIFLE | AKIN |
|---|---|---|
| Risk / Stage 1 — sCreatinine | ↑sCrea × 1.5 | ↑ sCrea × 1.5 or ↑≥0.3 mg/dl in sCrea |
| Risk / Stage 1 — Urine output | < 0.5 ml/kg per h × 6 h | < 0.5 ml/kg per h × 6 h |
| Injury / Stage 2 — sCreatinine | ↑sCrea × 2 | ↑sCrea × 2 |
| Injury / Stage 2 — Urine output | < 0.5 ml/kg per h × 12 h | < 0.5 ml/kg per h × 12 h |
| Failure / Stage 3 — sCreatinine | ↑sCrea × 3 or ≥ 0.5 mg/dl if baseline sCrea ↑ > 4.0 mg/dl | ↑sCrea × 3 or ↑≥0.5 mg/dl if baseline sCrea > 4.0 mg/dl |
| Failure / Stage 3 — Urine output | < 0.3 ml/kg per h × 24 h or anuria × 12 h | < 0.3 ml/kg per h × 24 h or anuria × 12 h |
| Loss | Complete loss of renal function > 4 weeks | source silent |
| End-stage | End-stage renal disease | source silent |
| Initiation of renal replacement therapy | source silent | Patients who receive RRT are considered to have met stage 3 criteria, irrespective of the stage they are in at the time of RRT. |
- What
- Same ruler, same three severity bands, same two measurements — creatinine fold-rise and urine output. AKIN's Stage 1 also fires on a smaller absolute rise; RIFLE alone keeps two tiers past Failure.
- Why
- The two systems diverge in three places, not two: RIFLE's Loss and End-stage tiers have no AKIN match, and AKIN separately defines Stage 3 by RRT initiation alone (the row below), a rule RIFLE does not carry.
Why this matters: AKIN's Stage 1 also fires on a smaller absolute creatinine rise (≥0.3 mg/dl) than RIFLE's Risk tier states, and RIFLE keeps two tiers past Failure (Loss, End-stage) that AKIN never names — reading a stage number across systems without this table risks under- or over-grading severity.
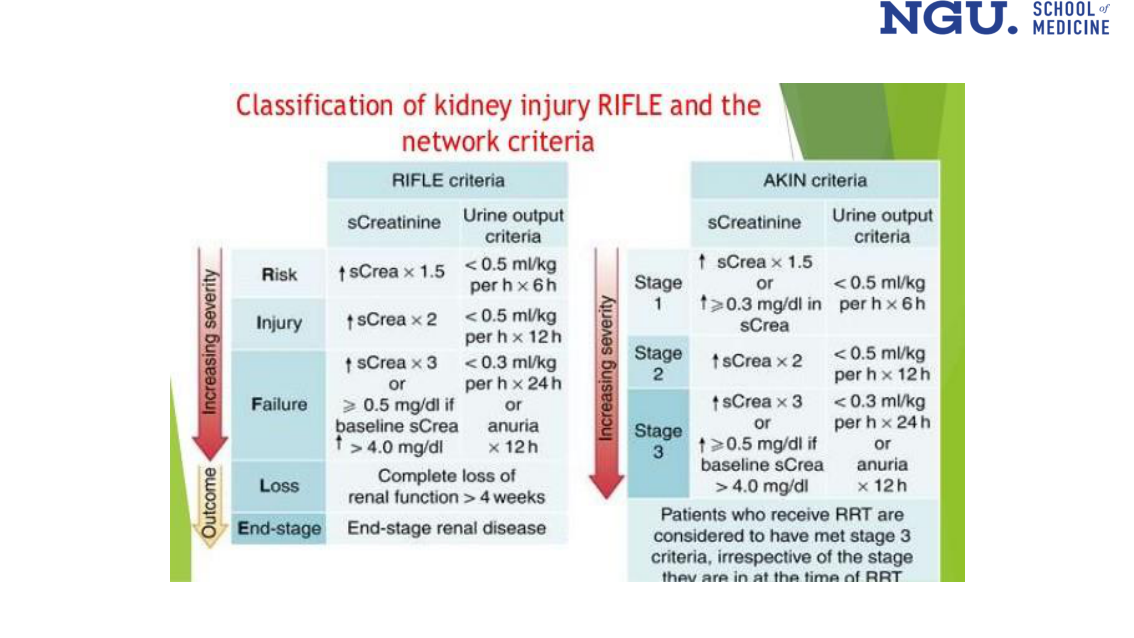
A staged severity chart: RIFLE's five tiers (Risk, Injury, Failure, Loss, End-stage) and AKIN's three tiers (Stage 1, Stage 2, Stage 3) each set against an sCreatinine threshold and a urine-output threshold, arranged least to most severe under an 'Increasing severity' label with an 'Outcome' marker.
The stepped shape ranks the tiers by severity at a glance and shows RIFLE running two tiers past where AKIN stops — a fact no single text line states outright.
- What
- RIFLE is the name of one system for grading how severe an episode of kidney injury is.
- Where
- The first of two staging tables on this slide; AKIN, the second, follows further down.
- Why
- She doesn't state why a formal severity scale is needed or what clinical decisions it is meant to guide.
- What
- One of RIFLE's two measurements: how much the blood creatinine has risen from baseline.
- Why
- She doesn't state why a rise in creatinine, rather than its absolute level, is the value tracked.
- What
- RIFLE's other measurement: how little urine the patient is making, per kg of body weight per hour.
- Why
- She doesn't state why urine output is normalised to body weight rather than measured as a raw volume.
- What
- RIFLE's mildest tier, Risk, is given as two criteria side by side: creatinine up 1.5-fold; urine output under 0.5 ml/kg/h.
- Why
- She doesn't state whether the creatinine and urine-output criteria must both be met, or either alone is enough.
- When
- The urine-output route only counts once that low output has lasted at least 6 hours.
- What
- RIFLE's middle tier, Injury, is given as two criteria side by side: creatinine up 2-fold; urine output under 0.5 ml/kg/h.
- Why
- She doesn't state why the urine-output duration doubles from Risk to Injury while the flow-rate threshold itself stays the same.
- When
- The urine-output route requires that same low output to persist for at least 12 hours — double Risk's window.
- What
- RIFLE's Failure tier: creatinine up 3-fold, or a jump of at least 0.5 mg/dl once baseline already exceeds 4.0 mg/dl.
- Why
- She doesn't state why a smaller absolute rise (0.5 mg/dl) counts once creatinine is already above 4.0 mg/dl.
- When
- By urine output: under 0.3 ml/kg/h for 24 hours, or complete anuria for as little as 12 hours.
- What
- Loss: kidney function stays completely gone — a separate, worse tier than Failure, not just a bigger number.
- Why
- She doesn't state why 4 weeks specifically is the line, rather than a shorter or longer window.
- When
- Counted only once that complete loss has lasted more than 4 weeks.
- What
- End-stage: end-stage renal disease — RIFLE's final and worst tier.
- When
- Unlike every other RIFLE tier, no duration or numeric threshold is given for when a case counts as End-stage.
- What
- Labels the direction of the RIFLE list: each stage further down (Risk toward End-stage) is more severe than the one before it.
The RIFLE stages are read low to high severity: Risk is mildest, End-stage is worst.
- What
- The RIFLE table is headed 'Increasing severity', marking the named tiers (Risk through End-stage) as a graded scale rather than a plain list.
- Where
- This heading sits directly beside the RIFLE criteria table, on the same slide as the creatinine and urine-output columns.
Why this matters: Without the ranking stated, the five names read as a category list rather than a severity scale, which changes what a stage number is supposed to communicate.
- What
- She labels this 'Outcome' next to the severity tiers but doesn't state what the outcome actually is.
- What
- AKIN is the second grading system on this slide, alongside RIFLE, for the same kidney-injury severity.
- Why
- She names AKIN as a second system without stating why it exists alongside RIFLE or when to use one over the other.
RIFLE and AKIN both grade AKI severity from the same two measurements — the rise in creatinine and the fall in urine output — but RIFLE keeps two tiers AKIN does not have.
AKIN stops at Stage 3; RIFLE continues to Loss and End-stage.
- What
- RIFLE (Risk, Injury, Failure, Loss, End-stage) and AKIN (Stage 1, Stage 2, Stage 3) grade AKI from the same two measurements: serum creatinine and urine output.
- Where
- AKIN's table sits directly after RIFLE's, under the same 'Classification of kidney injury' heading, using the identical creatinine/urine-output layout.
Why this matters: A reported stage doesn't carry its system with it — Loss and End-stage have no AKIN number to map to, so a stage read off one system cannot be assumed to mean the same severity on the other.
- What
- AKIN's first measurement, the same idea as RIFLE's: the rise in blood creatinine.
- Why
- She doesn't state why creatinine, rather than another marker, was chosen as one of the two measured criteria.
- What
- AKIN's second measurement, the same idea as RIFLE's: how low urine output falls.
- Why
- She doesn't state why AKIN kept the same per-kg urine-output measure as RIFLE rather than defining a new one.
- What
- AKIN's mildest tier, Stage 1, is given as two criteria side by side: creatinine up 1.5-fold or risen by at least 0.3 mg/dl; urine output under 0.5 ml/kg/h.
- Why
- She doesn't state why AKIN adds the absolute 0.3 mg/dl option that RIFLE's matching Risk tier doesn't have.
- When
- The urine-output route requires that low output to hold for at least 6 hours, same as RIFLE's Risk tier.
- What
- AKIN's middle tier, Stage 2, is given as two criteria side by side: creatinine up 2-fold; urine output under 0.5 ml/kg/h.
- Why
- As with RIFLE's matching tier, she doesn't state why the urine-output window doubles from Stage 1 to Stage 2.
- When
- The urine-output route requires that output to persist for at least 12 hours.
- What
- AKIN's most severe tier, Stage 3: creatinine up 3-fold, or a jump of at least 0.5 mg/dl once baseline already exceeds 4.0 mg/dl.
- Why
- As with RIFLE's Failure tier, she doesn't state why this smaller absolute rise counts once creatinine already exceeds 4.0 mg/dl.
- When
- By urine output: under 0.3 ml/kg/h for 24 hours, or complete anuria for as little as 12 hours — identical to RIFLE's Failure tier.
- What
- Anyone already on renal replacement therapy is automatically scored as AKIN Stage 3, regardless of their actual numbers.
- Why
- She states the rule but not why being on RRT is defined as meeting Stage 3.
KIDIGO Classification of AKI exception[L0082–L0082]
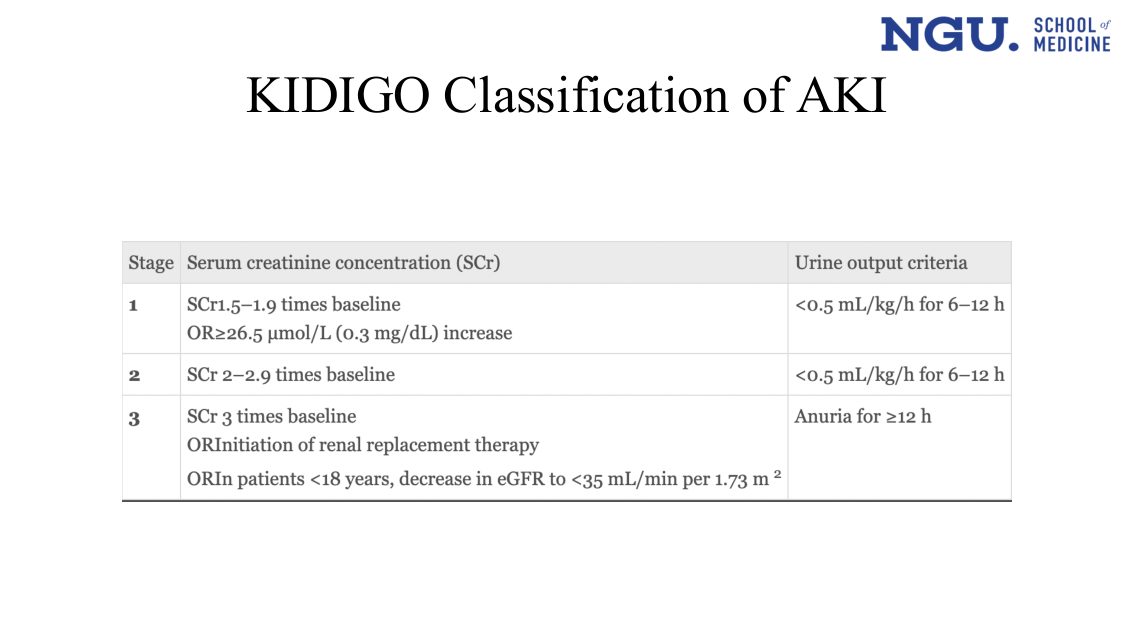
Stage 1: SCr 1.5–1.9 times baseline OR ≥26.5 μmol/L (0.3 mg/dL) increase | Urine output <0.5 mL/kg/h for 6–12 h. Stage 2: SCr 2–2.9 times baseline | Urine output <0.5 mL/kg/h for 6–12 h. Stage 3: SCr 3 times baseline OR initiation of renal replacement therapy OR (in patients <18 years) decrease in eGFR to <35 mL/min per 1.73 m² | Urine output: anuria for ≥12 h.
The KDIGO table itself, in full — the numeric SCr multiples, the absolute μmol/L/mg/dL threshold, the paediatric eGFR clause, and the RRT-initiation clause for Stage 3 — none of which exist as text anywhere else in the deck. The only text row for this slide was the bare heading.
Outline shown 3 of 6[L0084–L0097]
Epidemiology[L0099–L0106]
L0100
- What
- Using the KDIGO definition, about 1 in 5 adults and 1 in 3 children develop AKI at some point during a hospital stay.
- When
- Any time over the course of an inpatient episode, not specifically on admission.
L0102
L0103
- What
- About 5% of UK hospital admissions already have AKI that started in the community before arrival; half of those already have CKD too.
- Where
- UK figures specifically, and community-acquired — before any hospital-acquired component.
L0105
- What
- AKI affects about 1 in 4 patients with sepsis, and about 1 in 2 patients with septic shock — two separate figures, not a rise from one into the other.
AKI incidence rises with how severe the infection is: sepsis versus septic shock, same measure.
- What
- About 25% of patients with sepsis, and 50% of patients with septic shock, will have AKI — the same outcome at two severities of infection.
- Where
- Both figures are stated in the same sentence on the Epidemiology slide, right after the UK admission-rate figure.
Why this matters: The two figures come from different populations in the same sentence — sepsis alone versus septic shock — so citing '25%' or '50%' without saying which group it describes over- or understates the other group's risk.
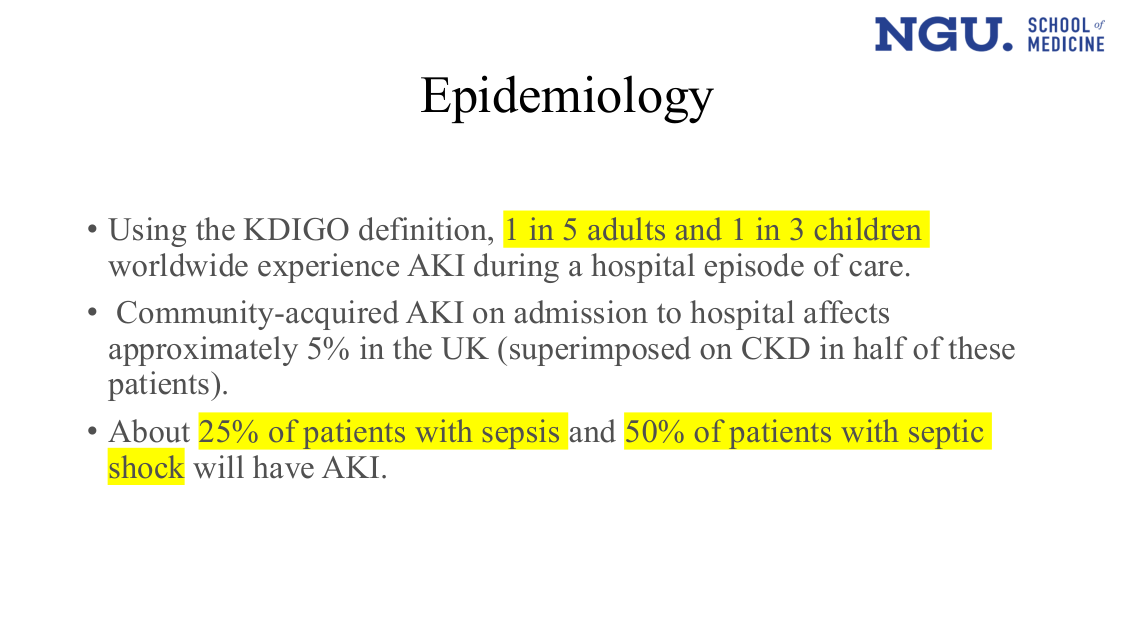
Three bullets matching the rows above verbatim. '1 in 5 adults and 1 in 3 children', '25% of patients with sepsis' and '50% of patients with septic shock' are highlighted yellow.
Highlighting picks out the four numbers she wants remembered from the three bullets; the 5% UK community-acquired figure is left unhighlighted.
Outline shown 4 of 6[L0108–L0121]
This Outline slide repeats, word for word, the same bullet list already given at the row above.
- What
- Repeats the same bullet list — Definition, Classification, Epidemiology, Approaching AKI causes, Management, Outcome, Other causes of AKI — word for word from the earlier Outline slide.
- Where
- Appears right after the Epidemiology section closes, marking a section break rather than new content.
Why this matters: Recognising the repeat as a section marker, not new content, stops the same bullet list from being read twice as if it were two different facts.
Approaching AKI[L0123–L0123]
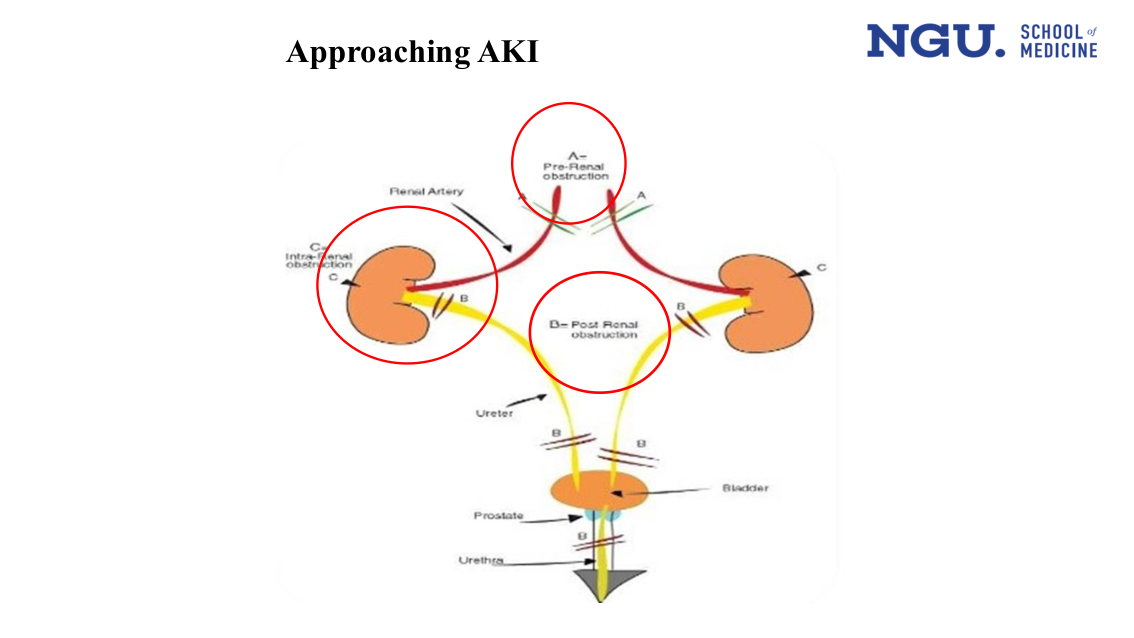
Three red circles name the three categories on one urinary tract: A - Pre-Renal obstruction around the renal artery where it leaves the aorta; C - Intra-renal obstruction around the left kidney; B - Post Renal obstruction around the upper ureters. Small uncircled hatch-marks then repeat the letters at every level the type can occur - A on both renal arteries, C on both kidneys, B on both ureters and again at the prostate and urethra.
The picture puts all three categories on one drawing, so post-renal is visibly the only one with several possible levels - ureter, bladder outlet, prostate, urethra - while pre-renal and intra-renal each have one.
Pre renal[L0125–L0137]
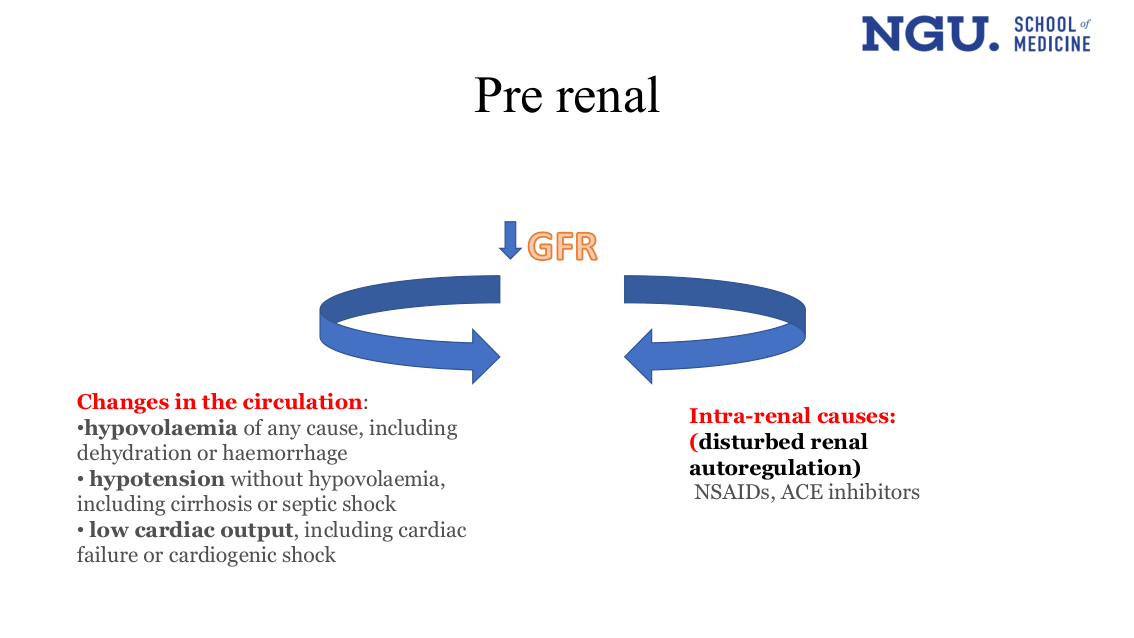
Top node reads ↓GFR — the falling arrow is the diagram's subject. One branch, 'Changes in the circulation', lists three drivers: hypovolaemia, hypotension without hypovolaemia, and low cardiac output. The other branch, 'Intra-renal causes (disturbed renal autoregulation)', names NSAIDs and ACE inhibitors.
The diagram's connecting arrows from GFR to each branch were not captured as text — the rows list the same content as separate lines with no arrow between them.
- What
- The thing at the centre of the diagram: pre-renal AKI is a fall in GFR, and the two boxes around it are the routes that cause that fall.
- Where
- Top of the pre-renal causes diagram, feeding from the 'changes in the circulation' and 'intra-renal causes' branches below it.
Both lower GFR. One is a whole-body circulation problem, the other is the kidney's own autoregulation being disturbed. The items inside each branch are alternatives, not a sequence.
Same effect, two different starting points.
- What
- Pre-renal AKI splits into two branches: changes in the circulation (hypovolaemia, hypotension without hypovolaemia, low cardiac output) and disturbed renal autoregulation (intra-renal, NSAIDs, ACE inhibitors).
- Why
- Both branches lower GFR from different starting mechanisms — a whole-body circulation problem versus a kidney-level autoregulation disturbance — not one shared cause.
Why this matters: Both branches are grouped under one heading (pre-renal) and produce the same fall in GFR from different starting points — a whole-body circulation problem versus a drug disturbing the kidney's own autoregulation — so conflating them hides which mechanism is driving the injury.
L0128
- What
- Hypovolaemia from any cause — she names dehydration and haemorrhage — is one of the three circulatory causes of pre-renal AKI listed here.
L0130
- What
- Hypotension without hypovolaemia — cirrhosis or septic shock are her examples — is a second circulatory route: the driving pressure drops even though volume is normal.
L0132
- What
- Low cardiac output, from heart failure or cardiogenic shock, is the third circulatory cause: the pump fails to deliver enough blood to the kidney.
L0134
L0135
- What
- The second branch: intra-renal causes, meaning the kidney's own autoregulation of blood flow is disturbed rather than the whole-body circulation failing.
- Where
- Still classed under Pre-renal on this slide, even though the disturbance sits inside the kidney's own arterioles.
- What
- NSAIDs and ACE inhibitors are her two named drug examples for the 'disturbed renal autoregulation' branch of pre-renal causes.
Autoregulation[L0139–L0148]
The Pre-renal slide names 'disturbed renal autoregulation' as an intra-renal cause; this slide gives the three substances that do the regulating.
Same mechanism, unpacked one slide later.
- What
- Names the three substances that regulate the kidney's own blood flow: prostaglandins, nitric oxide, and angiotensin acting on the afferent and efferent arterioles.
- Where
- Given on the very next slide after 'disturbed renal autoregulation' is named as a pre-renal, intra-renal cause, unpacking that phrase.
Why this matters: Without this slide, 'disturbed renal autoregulation' on the earlier slide names a mechanism with no stated substances behind it.
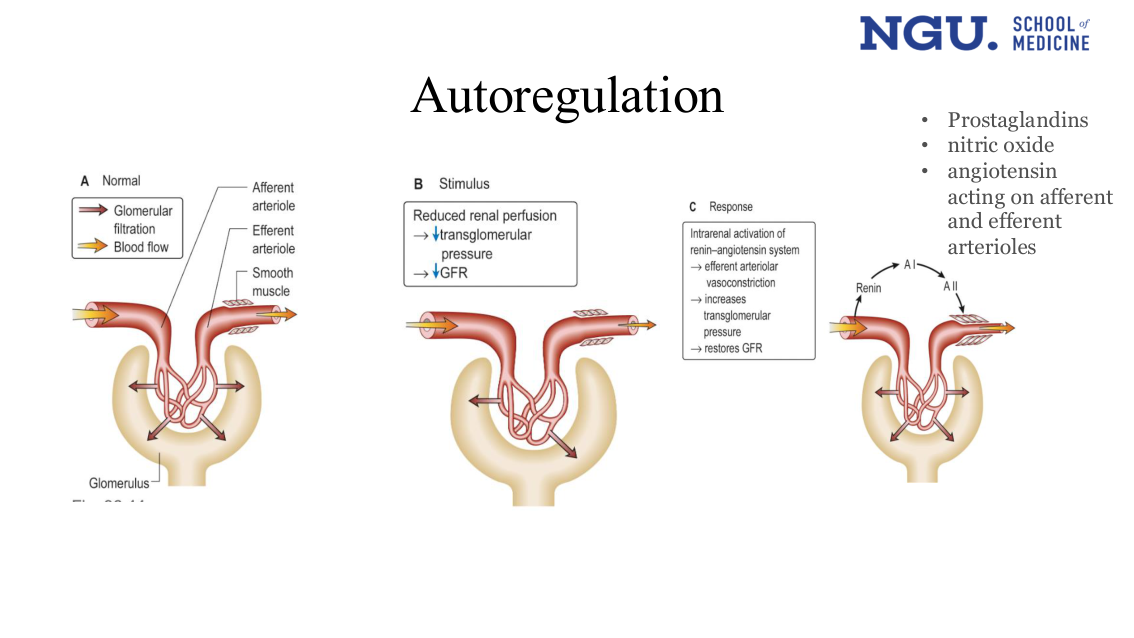
A Normal labels the afferent arteriole, the efferent arteriole, the smooth muscle and the glomerulus, with a legend separating glomerular filtration from blood flow. B Stimulus: reduced renal perfusion → ↓transglomerular pressure → ↓GFR. C Response: intrarenal activation of the renin-angiotensin system → efferent arteriolar vasoconstriction → increases transglomerular pressure → restores GFR. A fourth panel draws Renin → A I → A II with the constriction marked on the efferent arteriole.
The picture carries the step the bullet list does not: the arteriole angiotensin constricts to rescue GFR is the efferent one. Squeezing the outflow raises pressure across the filter; squeezing the inflow would lower it.
L0140
- What
- Prostaglandins are one of three substances she lists as regulating the kidney's own blood flow.
L0142
- What
- Nitric oxide is the second of the three autoregulation mediators she names, alongside prostaglandins and angiotensin.
L0144
L0145
L0146
L0147
- What
- Angiotensin is the third mediator, and the only one she names as acting on both the afferent and the efferent arteriole.
- Why
- Constricting the outflow holds pressure up across the filter, which is how the kidney defends GFR when perfusion falls. She lists ACE inhibitors separately as an intra-renal cause of AKI.
- How
- Panel C of this slide names the arteriole that matters: renin-angiotensin activation constricts the efferent one, which raises transglomerular pressure and restores GFR.
Is it prerenal or renal? shown 1 of 3[L0150–L0156]
- What
- History is named as one of the two tools for assessing suspected pre-renal AKI; she gives no detail on what to ask.
L0154
L0155
- What
- The physical signs of volume depletion she groups as one set: low blood pressure, a rapid pulse, sunken eyes, and collapsed neck veins.
- Why
- These are signs of hypovolaemia — the same circulatory cause of pre-renal AKI already named earlier on this slide.
Is it prerenal or renal? shown 2 of 3[L0158–L0166]
- What
- The BUN-to-creatinine ratio — the value used next to judge pre-renal versus renal AKI.
L0160
L0161
- What
- A BUN:creatinine ratio above 20:1, or a urea:creatinine ratio above 40:1, points to a pre-renal cause of AKI.
- Why
- In pre-renal AKI less urea is being filtered out, so it builds up in the blood faster than creatinine does.
The cutoff is not just an association — the lecture states the hormonal mechanism behind it.
Hypovolaemia is almost always associated with high…→>20:1 (BUN:C) or >40:1 (U:C) suggests pre-renal cause…
- What
- That disproportionate rise is what produces the pre-renal cutoff: >20:1 (BUN:C) or >40:1 (U:C).
- How
- The chain runs hypovolaemia → high ADH → increased reabsorption of water and urea → disproportionate rise in the urea:creatinine ratio, exactly as her 'Explanation:' states it.
Why this matters: Knowing the ADH-driven mechanism, not just the cutoff number, is what lets the ratio be read as pre-renal evidence rather than an isolated lab value.
L0164
L0165
- What
- Hypovolaemia raises ADH, and ADH increases reabsorption of both water and urea.
- How
- This pulls urea back up disproportionately more than creatinine, which is why the ratio rises in pre-renal AKI.
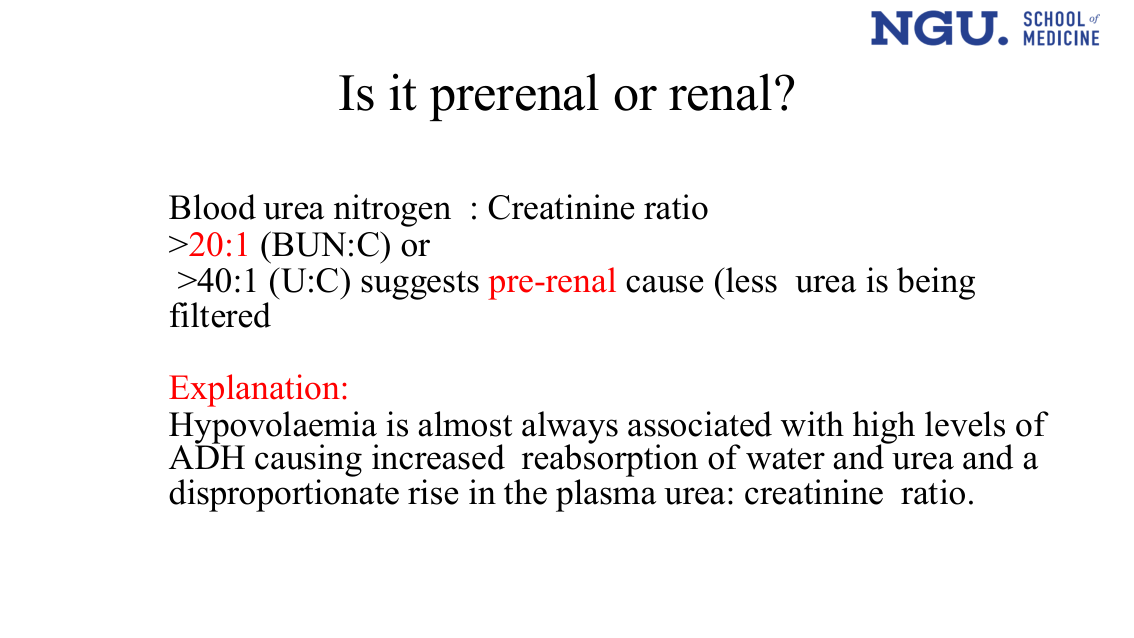 Full text-slide screenshot, not a separate diagram: the same BUN:creatinine text already in the rows above. Her own emphasis: 20:1 and pre-renal are printed in red, along with the word Explanation:, while >40:1 stays plain black — she marks the BUN:C ratio (20:1) as the one to remember, not the U:C ratio (40:1).
Is it prerenal or renal? shown 3 of 3[L0168–L0177]
- What
- She writes a lone 'X' on this slide; the lecture does not say what it marks.
L0170
L0171
L0172
L0173
L0174
L0175
L0176
- What
- FENa is calculated from creatinine and sodium measured in blood and urine at the same time.
- How
- Formula given: (urinary sodium × serum creatinine) divided by (urinary creatinine × serum sodium), times 100.
The lecture gives a diagnostic cutoff for the BUN:creatinine ratio in the text and gives the FENa cutoff on the slide 17 table rather than in the text rows.
- What
- Two tests distinguish pre-renal from renal AKI: the BUN:creatinine ratio (>20:1, or urea:creatinine >40:1) and FENa (<1% pre-renal, >1% intrinsic).
- Where
- The BUN:creatinine cutoff is stated in the text rows; the FENa cutoff appears only on the slide 17 table, not in the extracted text.
Why this matters: Both cutoffs are part of the lecture, but only one is in the extracted text rows — missing the slide table would wrongly read FENa as a formula with no stated threshold.
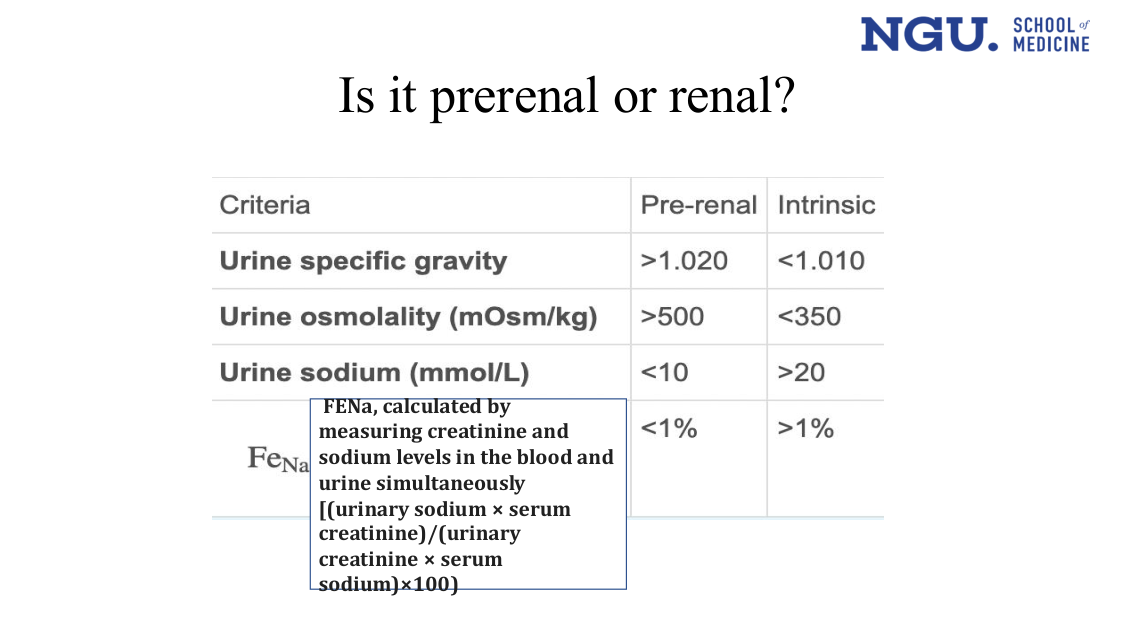
Table, 4 rows x 2 columns (Pre-renal | Intrinsic): Urine specific gravity — >1.020 | <1.010. Urine osmolality (mOsm/kg) — >500 | <350. Urine sodium (mmol/L) — <10 | >20. FeNa — <1% | >1%. A boxed note below repeats the FeNa formula text already in the rows.
The full pre-renal vs intrinsic lab cutoff table — specific gravity, osmolality, urine sodium and FeNa thresholds — none of which appear anywhere in the extracted text rows.
Management of prerenal AKI[L0179–L0187]
L0180
- What
- Most AKI cases involve some degree of hypovolaemia.
- Why
- So prompt fluid resuscitation is the most commonly indicated treatment.
L0182
L0183
- What
- A 250 mL crystalloid fluid challenge is used to test whether low blood pressure is fluid-responsive.
- When
- Given when it is unclear whether the patient's volume status is the cause of hypotension.
L0185
L0186
- What
- Crystalloids, especially balanced solutions such as plasmalyte and Ringer's lactate, are the recommended resuscitation fluids.
 A blue IV fluid-bag clipart icon beside the heading; no labels or values on it. Body text matches the fluid-resuscitation bullets already in the rows, highlighted in yellow. Her own emphasis: three phrases are highlighted in yellow on the slide - fluid resuscitation, fluid challenge of 250 mL crystalloid, and Crystalloids and particularly balanced solutions such as plasmalyte and Ringer’s lactate. The text conversion keeps the words and drops the emphasis.
Post-renal AKI[L0189–L0197]
- What
- Prostate disease in men is one cause of post-renal AKI.
- Where
- In men, via obstruction of the outflow tract at the prostate.
- What
- Bilateral obstruction of both ureters, from stones or tumours, is another cause of post-renal AKI.
AKI needs the whole outflow blocked. Count the tubes at each level.
Block one ureter and the other kidney carries on; below the bladder there is nothing to carry on with.
- What
- Below the bladder there is one urethra, so one blockage (prostate disease) causes obstruction; above the bladder there are two ureters, so both must be blocked.
- Where
- Below the bladder (urethra) versus above the bladder (ureters) — the two anatomical levels named as post-renal AKI causes.
Why this matters: The word 'bilateral' only makes sense once the tube count at each level is counted — without it, the ureter case and the urethra case look like the same kind of blockage.
L0193
- What
- Example: hesitancy and frequency on history point to prostatic hypertrophy in post-renal AKI.
- What
- Other examination findings suggesting obstruction: a palpable bladder and suprapubic dullness.
L0196
- What
- Ultrasound must be done to exclude obstruction as a cause of AKI.
- Why
- Because if obstruction is found and relieved in an acute case, kidney function returns to baseline.
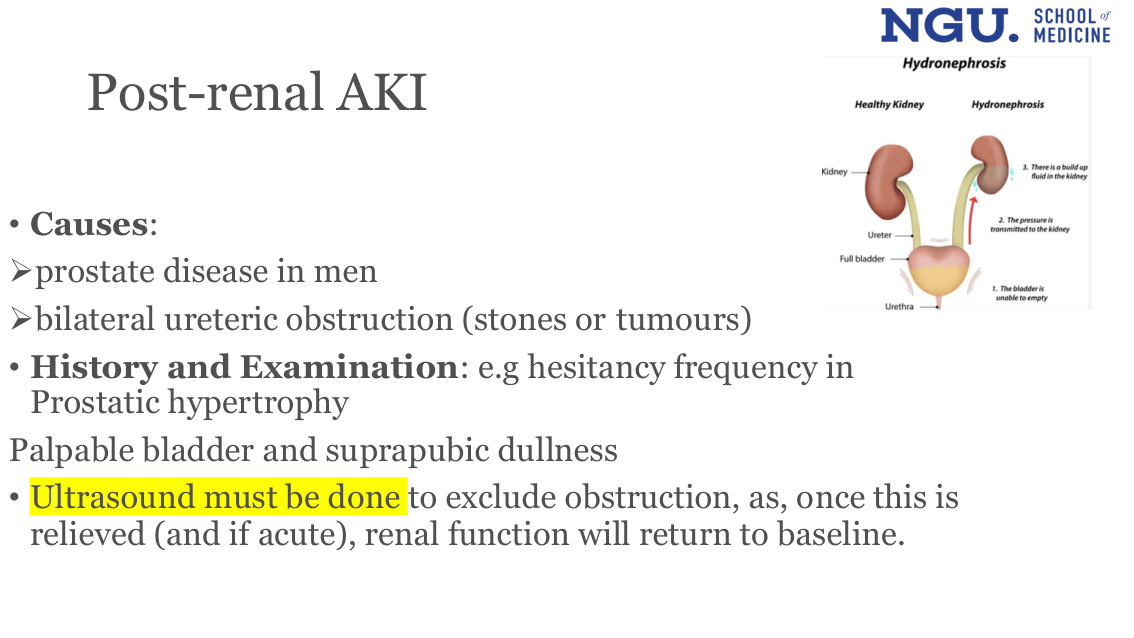
Hydronephrosis diagram, Healthy Kidney vs Hydronephrosis side by side. Labels: Kidney, Ureter, Full bladder, Urethra. An arrow runs upward from the bladder toward the kidney, numbered: 1. The bladder is unable to empty; 2. The pressure is transmitted to the kidney; 3. There is a build-up of fluid in the kidney.
Her own emphasis: Ultrasound must be done is highlighted in yellow - the action she marks as non-optional on this slide.
Renal parenchymal AKI shown 1 of 2[L0199–L0205]
- What
- Acute tubular necrosis (ATN) accounts for 80-90% of renal parenchymal (intrinsic) AKI - the dominant cause by far.
- Where
- The tubules, not the glomerulus or the vessels - that's what 'tubular' names in the term itself.
Acute tubular necrosis, 80-90% of renal parenchymal AKI, arises from either of two named causes.
One route has a stated mechanism; the other doesn't.
- What
- ATN is 80-90% of renal parenchymal AKI, arising from either prolonged prerenal AKI (a persisting low-flow state) or nephrotoxins such as aminoglycosides.
- How
- Both routes have a stated mechanism: nephrotoxins cause direct tubular injury and cell death; the prerenal route runs through the vasoconstriction-hypoxia-tubular injury chain given under 'Pathogenesis of ATN' (the rows below).
Why this matters: Same endpoint (ATN), different action: prolonged prerenal AKI is addressed by restoring perfusion (fluid resuscitation, the rows above); the nephrotoxin route is addressed by withholding/avoiding the drug (the rows below) or, if it caused the AKI, RRT to remove it (the row below).
- What
- One of two named routes into ATN: a prerenal (low renal blood flow) problem that persists instead of resolving quickly.
- How
- 'Pathogenesis of ATN' gives it: intrarenal vasoconstriction cuts O2, causing tubular hypoxia and endothelial/tubular cell damage (the rows below), and tubular cells' high metabolic rate makes them most vulnerable to that ischaemia (the rows below).
L0202
L0203
L0204
- What
- The second named route into ATN: nephrotoxins - drugs such as aminoglycosides - causing direct injury and cell death in the renal tubules.
- How
- Direct injury and cell death: she states the toxin acts straight on the tubule cells, with no intermediate step named.
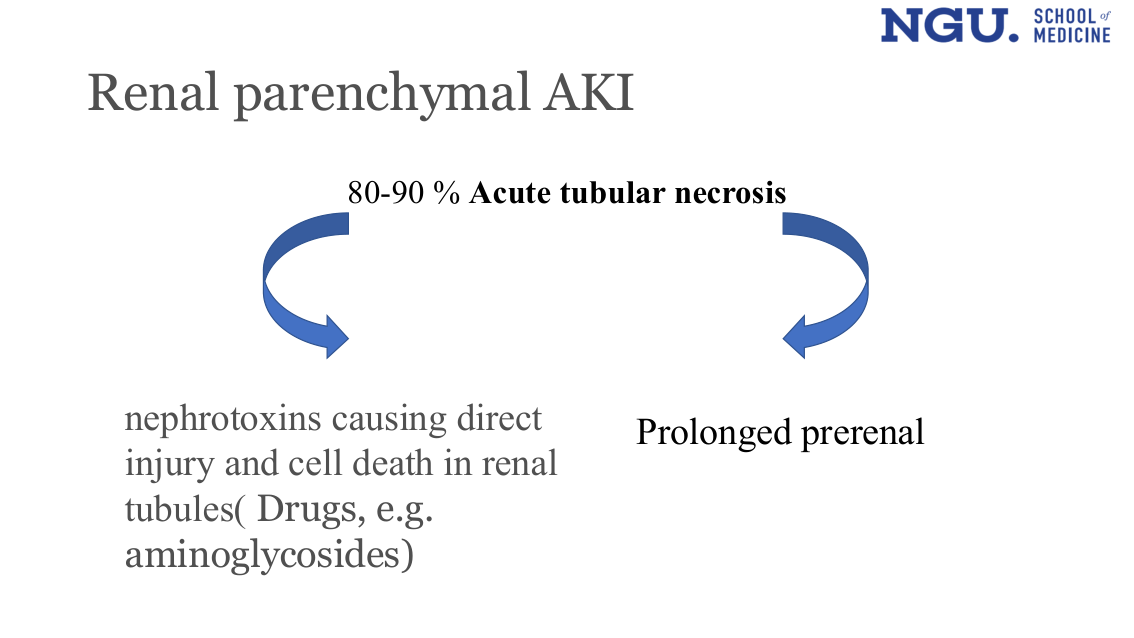
Two curved arrows drop from the '80-90% Acute tubular necrosis' header at top-centre: one down-left, arrowhead into 'nephrotoxins causing direct injury and cell death in renal tubules (Drugs, e.g. aminoglycosides)'; one down-right, arrowhead into 'Prolonged prerenal'.
Confirms these are two parallel, independent routes into ATN - both arrows originate from the same ATN header and neither points to the other - the same two causes already listed in the text, drawn as a branching diagram rather than stated as new.
Renal parenchymal AKI shown 2 of 2[L0207–L0216]
Renal parenchymal (intrinsic) AKI is split into three categories by which kidney structure is damaged.
Three sites named; only two given worked examples.
- What
- Three categories by damaged structure: Glomerular (acute rapidly progressive GN), Acute Tubulointerstitial (no example given), and Vascular (vasculitis, accelerated hypertension, cholesterol embolism, HUS).
- Where
- Named on the second 'Renal parenchymal AKI' slide, directly after ATN's two routes on the first.
Why this matters: Which structure is damaged sets the workup for at least one branch — glomerular disease points to the immune profile ordered when GN is suspected — but the deck names no corresponding test for the vascular or tubulointerstitial categories, so treating 'renal parenchymal AKI' as one bucket loses that distinction.
- What
- One of three site-based categories of renal parenchymal AKI: damage at the glomerulus, with acute rapidly progressive GN given as the example.
- Where
- The glomerulus - the kidney's filtering unit.
L0210
- What
- The example given for glomerular-type renal parenchymal AKI: acute rapidly progressive glomerulonephritis (GN).
- What
- A second category of renal parenchymal AKI, alongside Glomerular and Vascular: damage sited in the tubules and interstitium. Unlike the other two, no example diagnosis is given for it here.
- Where
- The tubules and the interstitial tissue surrounding them.
- What
- The third site-based category of renal parenchymal AKI: damage to the kidney's own blood vessels, with four named examples below it.
- Where
- The renal vasculature, as distinct from the glomerulus or the tubules.
L0214
L0215
- What
- Four named examples of vascular-type renal parenchymal AKI: vasculitis, accelerated hypertension, cholesterol embolism, and HUS.
Pathogenesis of ATN[L0218–L0223]
L0219
- What
- The sequence given for ATN's pathogenesis: constriction of the kidney's small vessels, a drop in oxygen, then tubular hypoxia.
- How
- The slide draws it as one chain: intrarenal microvascular vasoconstriction cuts oxygen delivery, and the tubule is left hypoxic. The text conversion dropped those arrows; the figure on this slide restores them.
The bullet lists vasoconstriction, a drop in oxygen, then tubular hypoxia in sequence; the arrows that joined them were dropped when the slide converted to text.
The sequence survives; the connecting symbols do not.
- What
- Lists, in order: intrarenal microvascular vasoconstriction, a drop in oxygen, then tubular hypoxia.
- Where
- First bullet under 'Pathogenesis of ATN', before endothelial/vascular damage and tubular cell injury.
Why this matters: The slide draws vasoconstriction, falling oxygen and tubular hypoxia as one causal chain with arrows; naming the lost arrows keeps the three terms from being read as an unordered list.
L0221
- What
- A separate bullet under Pathogenesis of ATN: structural damage to the endothelial and vascular smooth muscle cells. The slide draws no arrow tying it to the bullet above.
- What
- The third bullet under Pathogenesis of ATN: injury to the tubular cells themselves. Listed alongside the others, not drawn as following them.
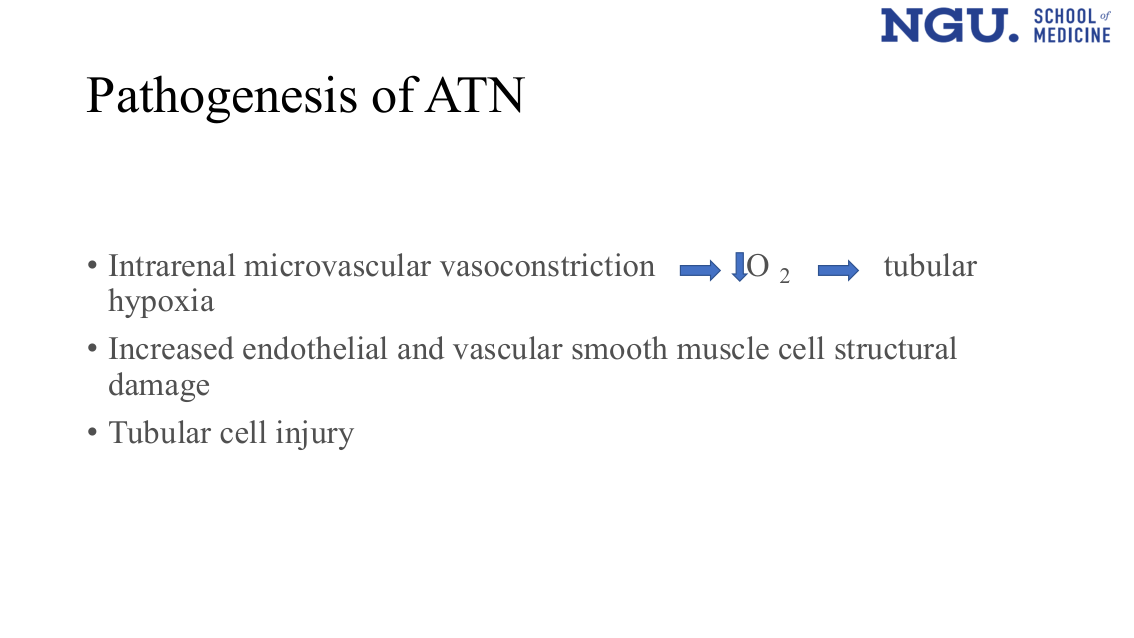
Only the first bullet carries arrows: 'Intrarenal microvascular vasoconstriction' [arrow] a downward arrow before 'O2' [arrow] 'tubular hypoxia' - one straight left-to-right chain of three terms. The second bullet ('Increased endothelial and vascular smooth muscle cell structural damage') and third bullet ('Tubular cell injury') sit below as separate, unconnected bullet points - no arrows link them to the first bullet or to each other.
Restores the exact arrows the text conversion lost: vasoconstriction causes decreased O2, which causes tubular hypoxia - one causal chain, not three independent labels. The other two bullets are NOT drawn as later steps in that chain; they stand alone with no arrow, so the diagram does not support reading this as a four-step ordered pathogenesis.
Acute Tubular Necrosis[L0225–L0234]
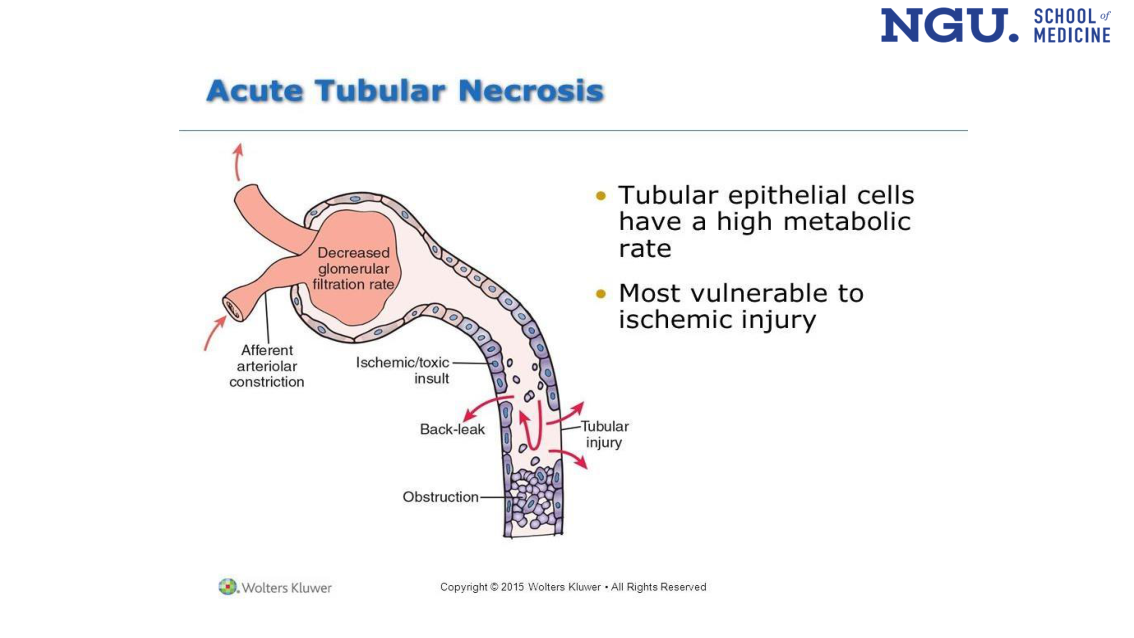
A single nephron drawn top to bottom. An afferent arteriole enters a glomerular loop labelled 'Decreased glomerular filtration rate', with 'Afferent arteriolar constriction' at the entering vessel. The tube runs down into a tubule labelled 'Ischemic/toxic insult', where two arrows point to 'Back-leak' and 'Tubular injury'. The tubule lumen at the bottom is filled with debris labelled 'Obstruction'.
The image sites each of the six terms at a specific point on one nephron and its arrows show flow/leak direction, not one term causing another - the flat text list gives no such order or link between them.
- What
- Tubular epithelial cells run a high metabolic rate compared with other renal cells.
- Where
- In the lining of the renal tubule.
- What
- Of all renal cell types, tubular epithelial cells are the most vulnerable to ischemic injury.
- Why
- She states they are most vulnerable to ischemic injury but does not connect this to the high metabolic rate stated on the line above - no 'because' is given.
Clinical picture[L0236–L0242]
L0237
- What
- Oliguria (reduced urine output) is the typical early pattern in AKI. When output is preserved instead — non-oliguric AKI — that itself points to a milder renal insult.
- Why
- She links insult severity to urine output (milder insult → non-oliguric) but does not explain why severity determines whether output is preserved.
- When
- Oliguria is described as an early-stage finding specifically.
L0239
- What
- ATN classically runs a fixed four-phase course, in order: onset, oliguric, diuretic, then recovery.
- Why
- She states ATN passes through these four phases but does not explain why the injury follows this particular sequence.
- How
- She names the four phases but does not state what drives the transition from one phase to the next.
L0241
- What
- Kidney function typically recovers within 7 to 21 days of the injury.
- Why
- She states that continuing sepsis delays recovery. She does not state why.
- When
- The 7–21 day estimate holds when sepsis has resolved; it does not apply to that timeframe once sepsis is ongoing, per the stated exception.
Emergency investigation of AKI[L0244–L0254]
L0246
L0247
L0248
- What
- Pre-renal AKI is diagnosed mainly by clinical examination, with assessing volume status as the key step.
- Why
- Pre-renal and renal AKI can be hard to tell apart because prolonged reduced kidney blood flow (pre-renal) can itself turn into ATN (renal).
- How
- 'Pathogenesis of ATN' names the steps: intrarenal vasoconstriction cuts oxygen delivery, causing tubular hypoxia and cell injury — tubular cells' high metabolic rate leaves them most vulnerable (the rows above).
L0251
L0252
- What
- A large, palpable bladder on exam suggests longstanding outflow obstruction; this is checked after passing (or flushing) a urethral catheter and seeing whether a large volume of urine drains.
- Where
- A bedside finding at the bladder itself, confirmed via catheter drainage.
- When
- The palpable-bladder finding specifically points to obstruction that has been present for some time, not an acute block.
- What
- Ultrasound of the kidneys and bladder is the second check used, alongside exam and catheterisation, to rule out outflow obstruction.
- Why
- She names ultrasound as the test used but does not state what finding on it would confirm obstruction.
 A red 'EMERGENCY' alarm-bell clipart icon top-right; body text matches the rows already transcribed (pre/renal/post-renal question, bladder-outflow-obstruction bullets), with 'assessing the volume status is vital' highlighted yellow. Her own emphasis: assessing the volume status is vital is highlighted in yellow on the slide. The words survive the conversion; the emphasis does not.
Investigations shown 1 of 2[L0256–L0265]
- What
- Red blood cells and red-cell casts in the urine point toward glomerulonephritis as the cause.
- Why
- She labels this finding indicative of glomerulonephritis and does not explain further.
- What
- Urine sent for culture — the one test in this list that looks for an organism rather than a chemistry.
- Why
- She lists it among the urine tests without saying what a positive culture would change in the management of the AKI.
L0260
- What
- Urine is checked for free haemoglobin and myoglobin.
- Why
- She does not state why urine is tested for these two substances specifically.
- When
- She says this applies 'where appropriate' but does not state which clinical situations that covers.
- What
- Urine protein:creatinine ratio (uPCR) is a urine test used in the AKI work-up.
- Why
- She states only that uPCR is helpful when parenchymal disease is possible, and does not go further.
- When
- Used specifically when parenchymal (intrinsic renal) disease is a possible cause, not for pre- or post-renal causes.
L0263
L0264
- What
- Newer urinary and plasma biomarkers — kidney injury molecule-1 and NGAL — are used to help detect AKI.
- Why
- She states this matters because these biomarkers may allow earlier treatment.
- When
- They rise within a few hours of the kidney injury.
Investigations shown 2 of 2[L0267–L0274]
L0268
- What
- A panel of eight blood tests: urea, electrolytes, creatinine, calcium, phosphate, albumin, alkaline phosphatase and urate.
- Why
- She lists these eight markers as part of the AKI panel but does not state what each detects or why it is included.
- What
- Complete blood count — the abbreviation she uses for the routine haematology panel.
- Why
- Listed without a stated purpose: she does not say which AKI cause a blood count is meant to point at.
- What
- A clotting screen, sent alongside the routine bloods.
- Why
- She names it but not what it rules in or out; the only bleeding-related risk she states is with anticoagulants, under management.
- What
- Blood cultures are sent, alongside the routine bloods.
- Why
- Not linked here to a cause, though she states separately that about 25% of sepsis and 50% of septic shock patients have AKI.
- What
- Blood levels of nephrotoxic drugs are checked where relevant.
- What
- An immune profile is sent as part of the AKI investigations.
- When
- Specifically when glomerulonephritis (GN) is suspected as the underlying cause.
Abdominal and pelvic Ultrasound[L0276–L0283]
L0278
- What
- One trigger for biopsy: urine protein or blood present without a clear explanation.
- Why
- She lists this as a trigger but does not say why unexplained proteinuria or haematuria specifically points to a diagnosis biopsy could reveal.
- What
- A trigger for biopsy: acute tubular necrosis that has not resolved on its own.
- Why
- She sets 4 weeks as the cutoff but does not explain why that duration, rather than another, is the trigger point.
- When
- Once persistent ATN has lasted longer than 4 weeks.
- What
- A trigger for biopsy: the cause of the AKI remains unclear after the rest of the workup.
- What
- A trigger for biopsy: a systemic (body-wide) disease is suspected as the cause.
- Why
- She flags systemic disease as a trigger without naming which diseases, or why biopsy would help identify them.
Outline shown 5 of 6[L0285–L0298]
Acute or chronic uremia?[L0300–L0335]
A prior creatinine reading, certain chronic biochemical changes, and kidney size on ultrasound each help tell a new kidney injury from long-standing kidney disease.
| Point of comparison | Acute Kidney Injury (AKI) | Chronic Kidney Disease (CKD) |
|---|---|---|
| Previous serum creatinine | Previous recent normal serum creatinine | Previous abnormal high serum creatinine |
| Anemia, high PTH hyperphosphatemia, hypocalcaemia, | Less common | More common |
| Kidney size on ultrasound abdomen | Kidney is normal in size | Kidney is small except in patients with diabetes who have normal or large sized kidneys |
| Chronicity of symptoms | Acute illness with acute/sudden onset of symptoms e.g. dyspnea, nausea, vomiting, diarrhea | Long previous history of symptoms e.g. fatigue, nausea, nocturia, itching |
| Oliguria (anuria) | Common | Common |
- What
- Four of the five rows are one axis restated four ways: new versus old. A previous normal creatinine, sudden symptoms, and a normal-sized kidney all say 'new'; their opposites say 'old'.
- Why
- Oliguria breaks that pattern: the source marks it 'Common' in both columns, so it is the one criterion on this table that cannot separate AKI from CKD.
Why this matters: This table is how AKI is told from CKD before treatment: the deck's recovery statements (ATN recovering in 7–21 days, post-renal AKI returning to baseline) are made only about AKI, never about CKD.
- What
- Labels the left-hand column, naming the criterion each row below compares.
- Where
- Heading of the table's first column, above every AKI/CKD comparison that follows.
- What
- Names the middle column — the AKI value for every comparison below.
- Where
- Sits directly across from the CKD heading.
L0303
- What
- Names the right-hand column — the CKD value for every comparison below.
- Where
- Paired opposite the AKI heading.
- What
- The first lab criterion: what the patient's creatinine was reading before this illness.
- Where
- Listed above the anaemia/PTH/phosphate/calcium pattern, the other lab criterion in this group.
L0307
- What
- In AKI, the creatinine recorded before this episode was recently normal.
- Where
- The AKI-column value for the previous-creatinine criterion, opposite the CKD value in the row below.
L0309
- What
- In CKD, the creatinine recorded before this episode was already abnormally high.
- Where
- The CKD-column value for the same previous-creatinine criterion, opposite the AKI value in the row above.
L0311
L0312
- What
- A set of four biochemical changes: anaemia, raised PTH, high phosphate, low calcium.
- Where
- The second lab criterion, listed below previous creatinine in this group.
- Why
- She marks this pattern less common in AKI and more common in CKD, and does not go further.
- What
- This biochemical pattern is less common in AKI.
- Where
- The AKI-column value for the anaemia/PTH/phosphate/calcium criterion, opposite the CKD value below.
- What
- The same biochemical pattern is more common in CKD.
- Where
- The CKD-column value for the same criterion, opposite the AKI value above.
L0317
- What
- The imaging criterion: what the kidneys look like in size on abdominal ultrasound.
- Where
- The only criterion listed under Radiology.
- What
- In AKI, the kidney appears normal in size on ultrasound.
- Where
- The AKI-column value for the kidney-size criterion, opposite the CKD value below.
L0320
L0321
L0322
- What
- In CKD, the kidney is usually small on ultrasound.
- Where
- The CKD-column value for the kidney-size criterion, opposite the AKI value above.
- Why
- She states the diabetic exception without explaining why diabetic kidneys stay normal or large instead of shrinking.
- What
- The criterion: how long the symptoms have been present.
- Where
- The only criterion listed under Symptoms here; its AKI/CKD values (sudden onset vs. long history) appear past this slice.
L0326
L0327
L0328
- What
- For AKI, symptoms are sudden — breathlessness, nausea, vomiting and diarrhoea all start acutely.
- Why
- This is the AKI side of the table's chronicity-of-symptoms row: abrupt onset is what marks a case acute rather than chronic.
Chronicity of symptoms splits the two conditions: AKI's symptoms start suddenly, CKD's have built up over a long history.
- What
- AKI presents as acute illness with sudden-onset symptoms (dyspnea, nausea, vomiting, diarrhea); CKD presents with a long previous history of symptoms (fatigue, nausea, nocturia, itching).
- Where
- The 'Chronicity of symptoms' row of the AKI-versus-CKD comparison table.
Why this matters: Symptom timing is one of the ways this lecture tells acute injury apart from chronic disease.
L0330
L0331
- What
- For CKD, the same kind of symptoms — fatigue, nausea, nocturia, itching — have built up over a long time rather than starting suddenly.
- Why
- This is the CKD side of the same row: a long symptom history, the opposite of AKI's sudden onset, is what separates chronic from acute here.
- What
- Introduces the table's second symptom-based comparison point between AKI and CKD: whether urine output falls (oliguria) or stops (anuria).
- Where
- Sits under the Symptoms category, alongside chronicity of symptoms, as one of two symptom-based rows in this comparison table.
- Why
- She doesn't say why oliguria/anuria was chosen as a comparison point, unlike chronicity of symptoms above.
Oliguria/anuria is marked common for both AKI and CKD — the one row in this comparison where the two conditions don't separate.
- What
- Oliguria (anuria) is marked 'Common' under both the AKI column and the CKD column of this comparison table.
- Why
- This is the one row where the two conditions share the same value, unlike the other rows that split old versus new.
Why this matters: Shows this finding does not help distinguish acute from chronic kidney disease.
- What
- Oliguria or anuria is marked common in AKI on this comparison table.
- Why
- She marks it common in AKI without explaining why reduced urine output occurs in acute injury.
- What
- Oliguria or anuria is also marked common in CKD — the same value as the AKI column.
- Why
- Both columns read 'Common', making this the one row in the slice where the table does not separate the two conditions.
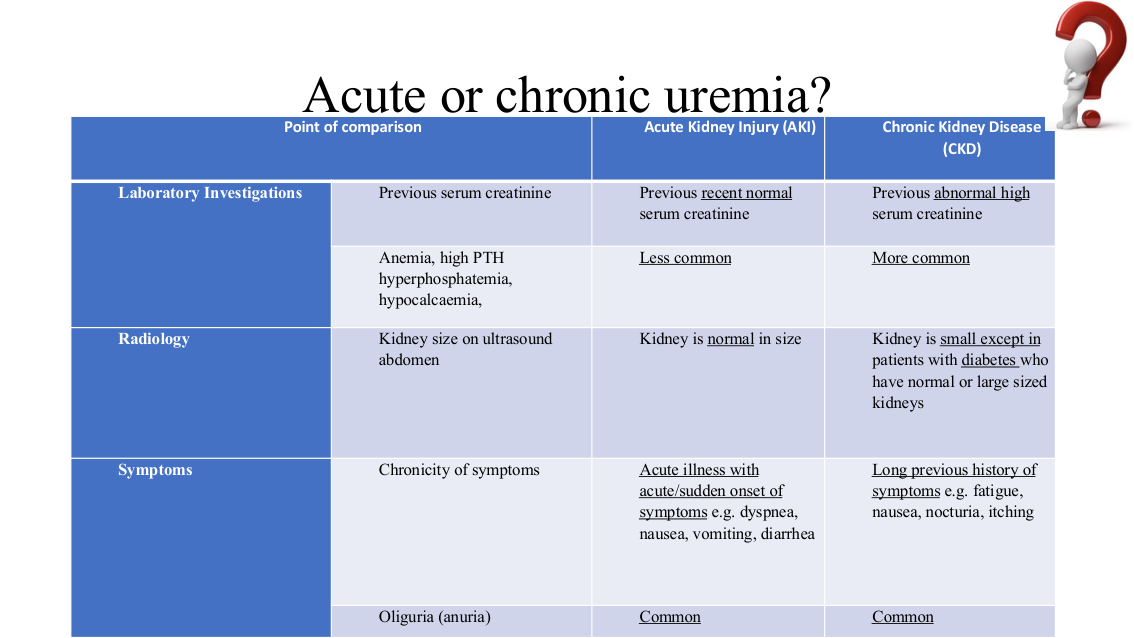
Closes the acute-vs-chronic comparison slide; its rows in this slice — chronicity of symptoms and oliguria/anuria — are already extracted as separate table_row lines above this marker.
Her own emphasis: every discriminating phrase in the table is underlined on the slide - the previous-creatinine pair, the kidney-size pair, and the oliguria pair that reads Common on both sides.
Management shown 1 of 2[L0337–L0345]
L0339
- What
- Tracking fluid intake and output, particularly urine output, is described as key to recovering from AKI.
- When
- She says fluid balance is key to recovery without stating how often it should be checked.
L0341
- What
- Weight and blood pressure, taken both lying and standing, are measured daily as part of general AKI management.
- Why
- She lists lying-and-standing blood pressure as a daily measurement without stating why the two positions are compared.
- When
- Done daily throughout management, not just once at initial assessment.
- What
- Medications are reviewed specifically to identify and withhold nephrotoxic (kidney-damaging) drugs.
- Why
- She doesn't restate here why nephrotoxic drugs are withheld — only that the review happens.
L0344
- What
- Collateral history and the patient's past results are both folded into the AKI management plan.
Closes the general-measures Management slide; its four bullets (fluid balance, daily weight/BP, medication review, collateral history) are already extracted as list items above this marker.
Her own emphasis: withhold nephrotoxins is highlighted in yellow among the general measures.
Management shown 2 of 2[L0347–L0356]
- What
- Hyperkalaemia is listed as a complication to manage in AKI, but referred out to a separate electrolyte-imbalance lecture rather than explained here.
- Where
- First of six complication-specific items on this second Management slide, ahead of acid-base balance and the rest.
- What
- Acid-base balance — specifically managing acidosis — is the second complication listed for AKI management.
- What
- Pulmonary oedema (fluid in the lungs) is listed as a complication to manage in AKI.
- What
- Sepsis is listed among the complications managed in AKI, with no detail given here.
Avoiding nephrotoxic drugs is stated twice: first as a general measure (medication review to withhold nephrotoxins), then again here with day-by-day dose adjustment and anticoagulants named as a particular risk.
- What
- First stated as 'medication review to withhold nephrotoxins'; restated here as nephrotoxins must be avoided, with day-by-day dose adjustment and a named risk with anticoagulants.
- Where
- First Management slide (general measures) and this second Management slide, under 'Use of drugs'.
Why this matters: Repetition across both Management slides marks nephrotoxin avoidance as a recurring priority, not a one-off point.
L0353
- What
- Nephrotoxic drugs must be avoided, and every drug's dose re-adjusted, in AKI.
- Why
- She flags anticoagulants as a particular risk without explaining why they specifically carry more danger than other drug classes.
- When
- Dosing is adjusted continuously, day by day, rather than set once.
- What
- Salt and potassium intake should be restricted as the nutritional measure in AKI.
- Why
- She doesn't say why salt and potassium specifically are restricted, rather than other nutrients.
Closes the second Management slide; its six bullets (hyperkalaemia, acid-base balance, pulmonary oedema, sepsis, drug use, nutrition) are already extracted above this marker.
Her own emphasis: Nephrotoxins must be avoided is highlighted in yellow - the same instruction she highlighted on the previous slide, marked twice.
Renal replacement Therapy[L0358–L0366]
L0360
- What
- Symptomatic uraemia is an RRT indication, specifically when it causes encephalopathy, pericarditis, or cardiac tamponade.
- Why
- She doesn't explain why these three complications specifically mark uraemia as dangerous enough to need dialysis.
- What
- RRT is indicated when hyperkalaemia can't be brought down with conservative (non-dialysis) measures.
- When
- Applies only once conservative measures have already been tried and failed, not as a first step.
- What
- RRT is indicated when pulmonary oedema fails to respond to diuretic treatment.
- When
- Applies only after diuresis has already been tried without success.
- What
- Severe acidosis alone is listed as an indication for RRT.
- Why
- She says 'severe' without stating where the threshold sits that counts as severe enough for RRT.
L0365
- What
- RRT is also used to remove drugs that caused the AKI itself — gentamicin, lithium, and severe aspirin overdose are named examples.
- Why
- She doesn't explain why dialysis can clear these particular drugs from the body.
Renal replacement[L0368–L0374]
- What
- One RRT option: haemodialysis given in scheduled sessions rather than continuously.
- What
- CRRT: continuous renal replacement therapy, an option that runs continuously rather than in sessions. The next two lines name its two forms.
- Where
- Sits as the umbrella label directly above its two named forms, haemodiafiltration and CVVHF, which specify what CRRT means in practice.
- Why
- She does not state why a patient would receive continuous CRRT rather than intermittent haemodialysis.
CRRT is not one technique but an umbrella term; the next two lines name its two specific forms.
- What
- CRRT is followed immediately by two named forms: haemodiafiltration (HDF) and continuous venovenous haemofiltration (CVVHF).
- Where
- Listed under 'Renal replacement Therapy' options, alongside intermittent haemodialysis and peritoneal dialysis.
Why this matters: Reading 'CRRT' as one specific technique rather than an umbrella would blur it with the two named forms underneath it (HDF, CVVHF), which are what actually gets ordered and run.
- What
- One named form of CRRT: haemodiafiltration, abbreviated HDF.
- What
- The other named form of CRRT listed here: continuous venovenous haemofiltration, abbreviated CVVHF.
- What
- The third RRT option listed: peritoneal dialysis.
Outline shown 6 of 6[L0376–L0397]
This Outline slide repeats the same bullet list shown on the lecture's earlier Outline slides, adding one line the earlier copies do not have: Acute Hyperuricemic nephropathy.
- What
- Repeats the same Outline bullet list — Definition through Other causes of AKI (Rhabdomyolysis, Contrast induced, Acute tumour lysis syndrome) — and adds one new line: Acute Hyperuricemic nephropathy.
- Where
- Sixth and final appearance of this Outline slide (shown 6 of 6), just before the causes-of-AKI section resumes.
Why this matters: Spotting the repeat and its one addition marks Acute Hyperuricemic nephropathy as the new topic about to be covered, rather than reading the whole list as freshly introduced content.
L0377
L0379
L0381
L0383
L0388
L0390
L0392
Other causes of AKI shown 1 of 7[L0399–L0408]
- What
- Names this section's topic: rhabdomyolysis, also called "crush syndrome."
The lecture gives two names for one entity here: rhabdomyolysis and "crush syndrome."
- What
- Rhabdomyolysis and 'crush syndrome' are given as two names for the same entity: skeletal muscle injury that provokes release of intracellular myoglobin.
- Where
- Both names appear together in the heading line opening the 'Other causes of AKI: Rhabdomyolysis' slide.
Why this matters: A question or report using either term is asking about the same condition — treating them as two separate entities would double-count one topic.
- What
- Muscle injury releases myoglobin — a protein normally confined inside muscle cells.
- Where
- Myoglobin sits inside skeletal muscle cells until the injury releases it.
- Why
- She states muscle injury releases myoglobin but does not say how or why that release goes on to injure the kidney — the link between rhabdomyolysis and AKI itself.
- What
- Two stated causes of rhabdomyolysis: trauma and compartment syndrome.
- Why
- She names these as causes but does not state the mechanism by which either damages muscle.
- What
- A third cause: excessive physical exertion — she gives marathon runners as the example.
- What
- A fourth stated cause: status epilepticus.
L0406
- What
- A fifth cause: muscle toxins — she names statins, malaria, antimalarial drugs, and snake or insect venom as examples.
- Why
- She lists these agents as toxic to muscle but does not state how each one damages muscle tissue to release myoglobin.
- What
- States three raised lab values listed here: potassium (K), phosphate (PO4), and CPK.
- Why
- She lists these three values as raised but does not explain why muscle breakdown raises each of them.
Other causes of AKI shown 2 of 7[L0410–L0415]
- What
- Names the complication covered next: nephropathy (kidney damage) caused by iodinated contrast dye used in imaging.
L0412
L0413
L0414
- What
- Iodinated contrast dye used in imaging can be toxic to the kidneys in some patients.
- Where
- The toxicity acts on the renal blood vessels and on the renal tubules.
- How
- Two possible routes, both stated as 'possibly': the dye constricts renal vessels, and/or it directly damages the tubules.
- When
- The risk is specifically in patients whose renal function is already impaired before the contrast is given.
Other causes of AKI shown 3 of 7[L0417–L0423]
- What
- Names the next complication under discussion: tumour lysis syndrome.
L0419
- What
- Tumour lysis syndrome is a complication that follows treatment of lymphoproliferative tumours.
- When
- Specifically the first treatment given for these tumours.
L0421
L0422
- What
- Chemotherapy, or even steroids alone, causes malignant cells to die rapidly and release their internal contents into the blood.
- How
- The released material specifically includes uric acid, potassium and phosphate — the substances that build up to cause the syndrome.
Slide repeats the row text verbatim, but highlights URIC ACID in yellow within the sentence listing released products (uric acid, potassium, phosphate).
The yellow highlight singles out uric acid as the emphasised product among the three released — a visual cue the plain text does not carry, and it foreshadows the next three slides, all on acute hyperuricaemic nephropathy specifically.
Other causes of AKI shown 4 of 7[L0425–L0432]
- What
- Names the specific mechanism of kidney injury covered next: kidney damage from excess uric acid.
- When
- Can happen either before chemotherapy is given, or after it — not confined to one window.
L0428
- What
- Chemotherapy causes tumour cells to lyse (burst apart).
- How
- Chemotherapy bursts the tumour cells; she states that large amounts of nucleoprotein are released and that uric acid production rises. She does not name the step between them.
L0430
L0431
- What
- Renal failure here comes from physical obstruction, not from direct toxicity to kidney tissue.
- Where
- Both inside the kidney (collecting ducts) and outside it (renal pelvis, ureters).
- How
- Uric acid crystals deposit in these structures and physically block urine flow.
Tumour lysis raises uric acid production, and the excess uric acid then crystallises and blocks the urinary tract, causing renal failure.
tumour cells lyse in response to chemotherapy, large…→Renal failure is due to intrarenal and extrarenal…
- What
- Tumour cell lysis releases nucleoprotein, raising uric acid production; the excess uric acid crystallises and obstructs the collecting ducts, pelvis and ureters, causing renal failure.
- How
- Stated as chemotherapy → cell lysis → uric acid overproduction → crystal deposition → intrarenal/extrarenal obstruction → renal failure.
Why this matters: Naming the two-step chain — overproduction then crystallisation and obstruction — is what makes prevention (lowering uric acid before it crystallises) the logical target, rather than treating the renal failure as unrelated to the tumour lysis.
Other causes of AKI shown 5 of 7[L0434–L0439]
- What
- Same condition as before, now covered from the diagnosis angle.
L0436
- What
- Diagnosis combines lab evidence (hyperuricaemia) with the clinical picture, rather than resting on either alone.
L0438
- What
- Ultrasound may show extrarenal obstruction caused by stones — but it may also look unremarkable despite obstruction being present.
Other causes of AKI shown 6 of 7[L0441–L0448]
- What
- Same condition again, now covered from the treatment angle.
L0444
- What
- Allopurinol is given as prevention.
- When
- Started before radiotherapy or cytotoxic (chemotherapy) treatment begins, and continued throughout it.
- What
- Fluids are given, either by mouth or intravenously, as part of treatment.
L0447
- What
- Urine is made more alkaline as part of treatment.
- How
- Achieved by giving sodium bicarbonate.
 Plain text slide; every line already appears as its own row above. Her own emphasis: Allopurinol is printed in bold italic inside its bullet, distinct from the plain surrounding sentence — she is calling out the drug name itself, not just the sub-heading.
Other causes of AKI shown 7 of 7[L0450–L0458]
- What
- Names the condition under discussion — acute hyperuricaemic nephropathy — before the treatment bullets that follow describe how it is managed.
- Where
- Sits after this lecture's earlier coverage of the condition's cause and diagnosis, and after first-line allopurinol treatment; this slide is the treatment continuation.
L0453
L0454
- What
- Febuxostat, a non-purine analogue drug, is one option for treating acute hyperuricaemic nephropathy.
- How
- It works by inhibiting xanthine oxidase — that is as far as the mechanism is stated.
- When
- Used specifically when allopurinol cannot be tolerated, and only if eGFR is above 30 mL/min — not a first-line choice.
- What
- Rasburicase, a recombinant urate oxidase enzyme, is offered as a further drug option alongside febuxostat for this condition.
- How
- She names it a recombinant urate oxidase and does not say more — no mechanism, no dose, no timing relative to febuxostat.
L0457
- What
- Dialysis is used to bring plasma urate down directly, as a treatment route separate from the two drugs above.
- Why
- She ties the need for dialysis to how oliguric or anuric the patient is but does not state why reduced urine output demands this route.
- When
- Specifically for patients who are severely oliguric or anuric — not stated as needed for milder cases.
 Plain text slide; every line already appears as its own row above. Her own emphasis: Rasburicase is printed in bold italic inside its bullet, the same treatment given to Allopurinol on the previous slide — Febuxostat in the bullet above it is left plain.
Other causes of CKD exception[L0460–L0465]
- What
- Names the condition this slide covers: hepatorenal syndrome, a cause of acute kidney injury.
- Where
- Placed under this document's '## Other causes of CKD' heading, even though the content describes a cause of AKI, not CKD.
L0462
L0463
L0464
- What
- In hepatorenal syndrome, kidney failure comes from severe constriction of the renal blood vessels, not from damage to the kidneys themselves.
- Where
- The kidneys are histologically normal; the problem sits in their blood supply, occurring in patients with cirrhosis, portal hypertension and ascites.
- How
- She states that vasoconstriction is the mechanism but does not state what in cirrhosis, portal hypertension or ascites triggers that constriction.
Outcome[L0467–L0475]
- What
- States plainly that AKI's outcome is not fixed; the three bullets below give the range from good to poor.
- Where
- Introduces the three outcome bullets that follow, each naming a different clinical scenario rather than one single prognosis.
AKI's mortality risk is not fixed: it rises with how complicated the case is, worst with ITU-level non-renal organ failure. Separately, the lecture states sepsis-related AKI carries a worse prognosis than AKI without sepsis — it is not benchmarked against the ITU figure.
- What
- Uncomplicated AKI carries under 5–10% mortality; AKI with non-renal organ failure in the ITU carries 50–70% mortality; sepsis-related AKI is stated as worse than non-septic AKI, with no percentage given.
- Why
- These are two separate comparisons, not one ranked scale — the sepsis line is never benchmarked against the ITU figure.
Why this matters: Prognosis in AKI depends on context, but the source makes two separate comparisons here, not one ranked scale of three: uncomplicated AKI vs ITU-level organ failure by percentage, and sepsis-related AKI vs non-sepsis AKI with no percentage given — the sepsis line is not stated to beat the ITU figure.
L0469
- What
- Uncomplicated AKI, occurring on its own, has a good outlook: under 5–10% mortality.
- Why
- She states this outcome as a fact and does not explain why uncomplicated AKI carries a better prognosis.
L0471
L0472
- What
- AKI layered onto failure of other organs, in an ITU setting, is far more dangerous: 50–70% mortality.
- Why
- She uses 'associated with', not a causal claim: AKI plus non-renal organ failure in the ITU setting is associated with 50–70% mortality, above the uncomplicated case above.
L0474
- What
- AKI occurring with sepsis carries a worse prognosis than AKI without sepsis present; no percentage is given for this group.
- Why
- She states sepsis worsens the prognosis but gives no mortality figure for this group and does not state why sepsis is the factor that matters.